Turning Real-World Data
into analytics
We analyze real-world data, build interactive dashboards, and conduct research to solve community challenges — powered by data volunteers in Uzbekistan.
Analytics Overview
Real-time community data
Monthly Activity
Data Trend
Built on Three Core Pillars
Everything we do is guided by a commitment to data quality, community collaboration, and the growth of local talent.
Practical Data Projects
We work with real, locally-sourced datasets to build interactive dashboards and analytical tools that create tangible value for communities across Uzbekistan.
Collaborative Research
Our volunteer researchers produce insightful reports on economics, education, transportation, and more — all open and freely accessible to the public.
Volunteer Growth
We invest in growing local data talent by mentoring analysts, engineers, and researchers — building a thriving ecosystem of data professionals in Uzbekistan.
Everything you need to know
Without reading everything.
IT Community Event Optimization
How can IT Community improve its events and community engagement through data?
66 respondents said location prevents them from attending
102 respondents attend primarily for networking opportunities
83 respondents want Career Development, 82 want AI topics
62% of respondents are interested in AI-related event topics
88% said they are likely or very likely to attend future events
Measuring Real Impact
Before & After — See What Changed
After presenting our findings and recommendations, we follow up with IT Community to understand how the research helped and which recommendations proved most useful.
- 1How did our research help IT Community?
- 2Which recommendations were the most useful?
- 3Which recommendations did you implement?
- 4Did the research change the way you plan or organize events?
- 5What value did you find in the project?
Once recommendations are implemented, we compare relevant metrics with the period before our research and present the results as a Before → Research → Implementation → After timeline.
- Average Event Attendance
- Event Registrations
- Attendance Rate
- Participant Satisfaction
- Returning Participants
- Participant Engagement
We only use metrics that are available and relevant to IT Community — and we share the final information with you for approval before publishing.
Data collected before research & after implementation of recommendations.
Featured Projects & Dashboards
Explore the core outputs from our IT Community study.
How Can IT Community Improve Events and Increase Participant Engagement?
Completed survey research analyzing participant behavior, satisfaction, motivations, and barriers to improve IT Community event quality and engagement.

IT Community Engagement Dashboard
Interactive dashboard summarizing participation trends, satisfaction levels, motivations, and barriers across the 133-response dataset.
Full Research Report
Comprehensive report with key findings, evidence-based recommendations, and practical actions for strengthening IT Community events.
Interactive Data Explorer
Filter and compare survey responses by role, attendance patterns, format preferences, and engagement drivers to uncover targeted insights.
Meet Our Data Volunteers
A passionate community of analysts, engineers, and researchers working together.
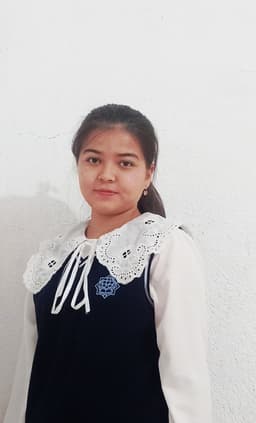
Jansulu Atabekova
Community & Team Lead
Directs team vision, community outreach, and project operations for IT Insights Lab.

Abdulatif Botirsherov
Data Collection Lead
Leads data collection strategy, survey design, and field data acquisition for community analytics.

Dinora Madaminova
Visual Lead
Specializes in data visualization, UI/UX design, and creating impactful dashboard experiences.

Jasmina Abakumova
Data Analyst
Performs exploratory data analysis, data cleaning, and statistical insights from survey metrics.
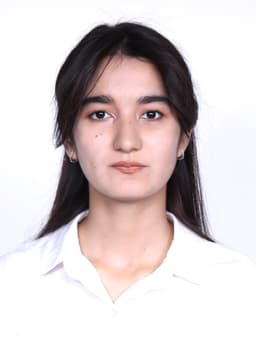
Nafisa G'anijonova
Reports Lead
Oversees research reporting, documentation synthesis, and publication of data insights.

Rayxon Irisqulova
Data Analyst
Focuses on quantitative analytics, survey response modeling, and community data aggregation.

Shoxistaxon Iriskulova
Research Lead
Drives research methodology, roadshow analytics frameworks, and qualitative survey analysis.

Want to Join the Team?
We are always looking for passionate data enthusiasts. Whether you are a beginner or a senior, there is a project for you.
Numbers That Tell the Story
Real metrics from our community-driven work across Uzbekistan.
Want to Collaborate or Contribute?
Whether you're a data professional, student, or organization, we'd love to hear from you. Join our growing community of data volunteers making an impact across Uzbekistan.
Send us a message
Fill out the form below and we'll be in touch.